Data Visualization
-
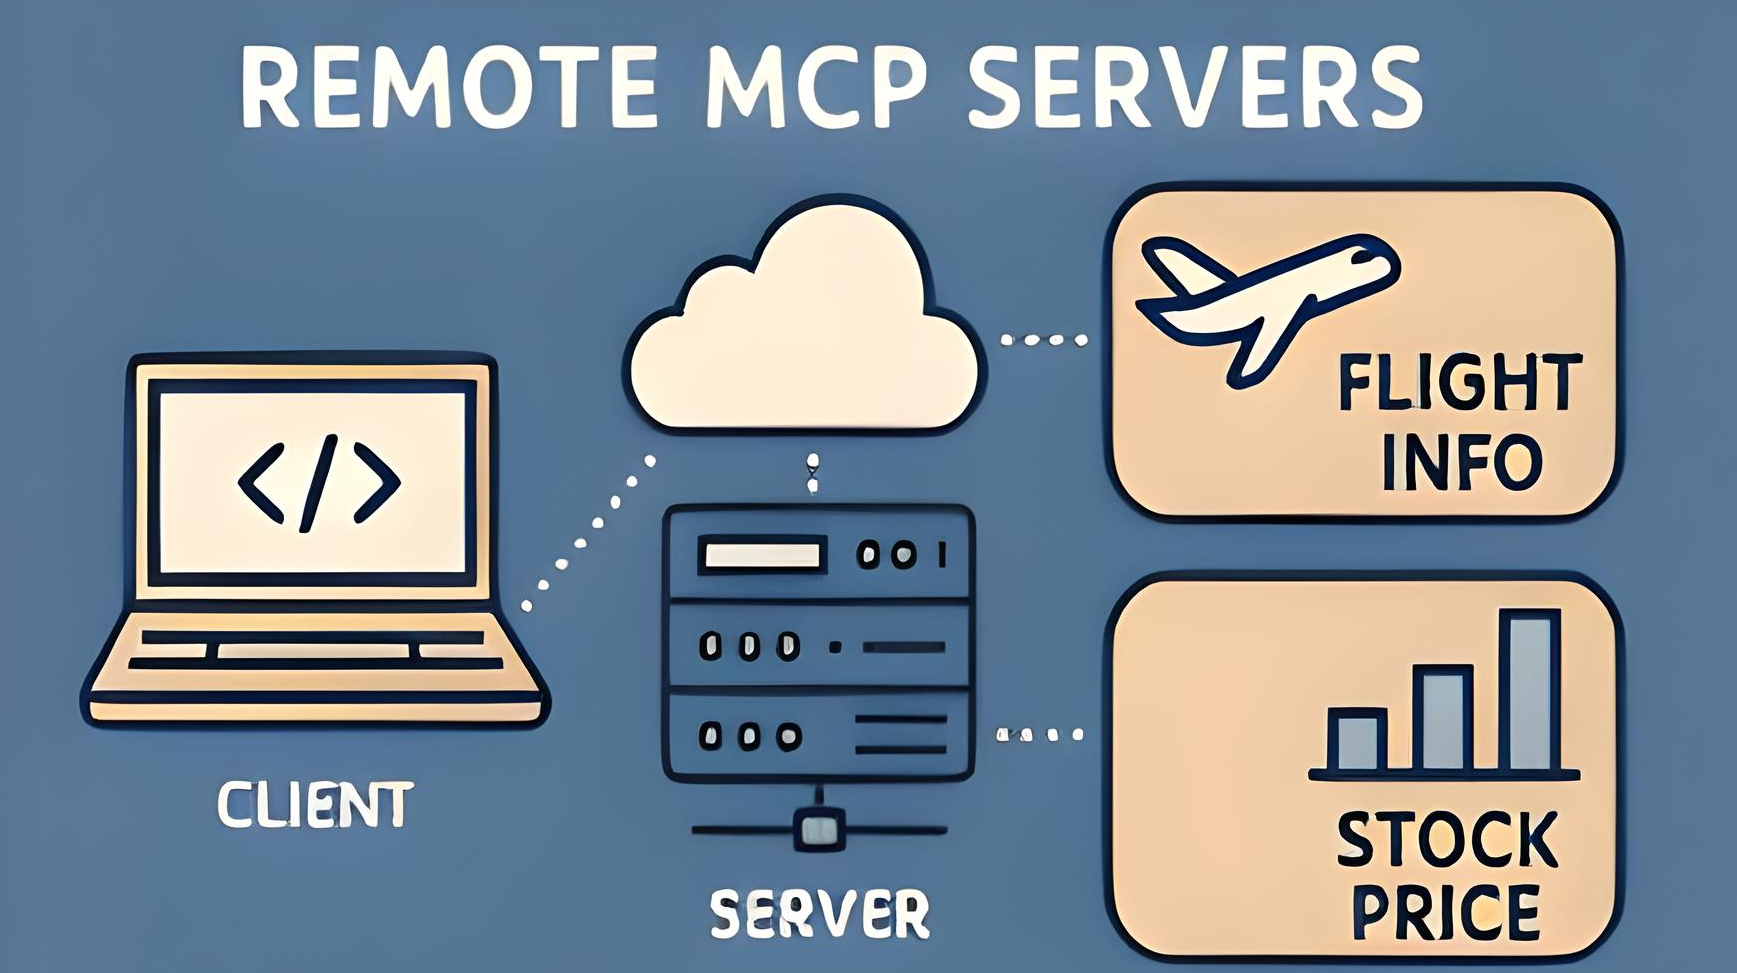
Writing, testing and using them.
15 min read -

Is there a way to use the out-of-the-box features of Power BI to be IBCS…
12 min read -
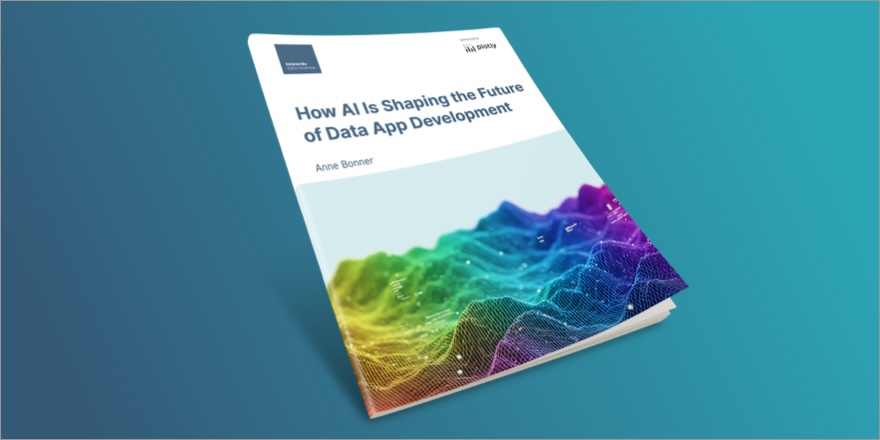
Explore the shift from static reports to intelligent apps with our first ebook.
2 min read -

How I built an AI-powered prototype to turn images into insights
16 min read -
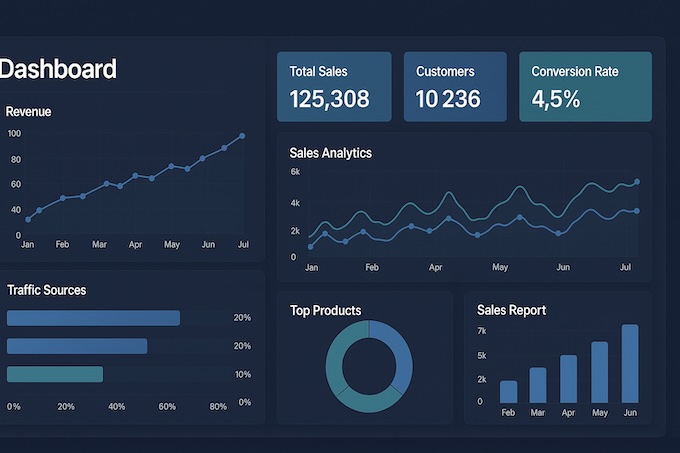
A guide to building a front-end data application.
11 min read -
A useful tool in your quiver
8 min read -

Use LazyPredict and PyCaret to skip the grunt work and jump straight to performance.
4 min read -

5 Crucial Tweaks That Will Make Your Charts Accessible to People with Visual Impairments
Data VisualizationMore than 350 million people are colorblind – Make sure they can read your visualizations.
13 min read -

An accessible dive into correlation, base proportions, summary statistics, and uncertainty.
7 min read -

How to visualize sentiment using a procedural smiley face in Python with OpenCV and Tkinter
8 min read