Data Visualization
-

Make Your Data Move: Creating Animations in Python for Science and Machine Learning
Data VisualizationGo beyond static plots with matplotlib.
6 min read -

Working in data science, it can be hard to share insights from complex datasets using…
6 min read -

Microsoft PowerBI is a one of the most popular business intelligence (BI) tools, and while…
6 min read -
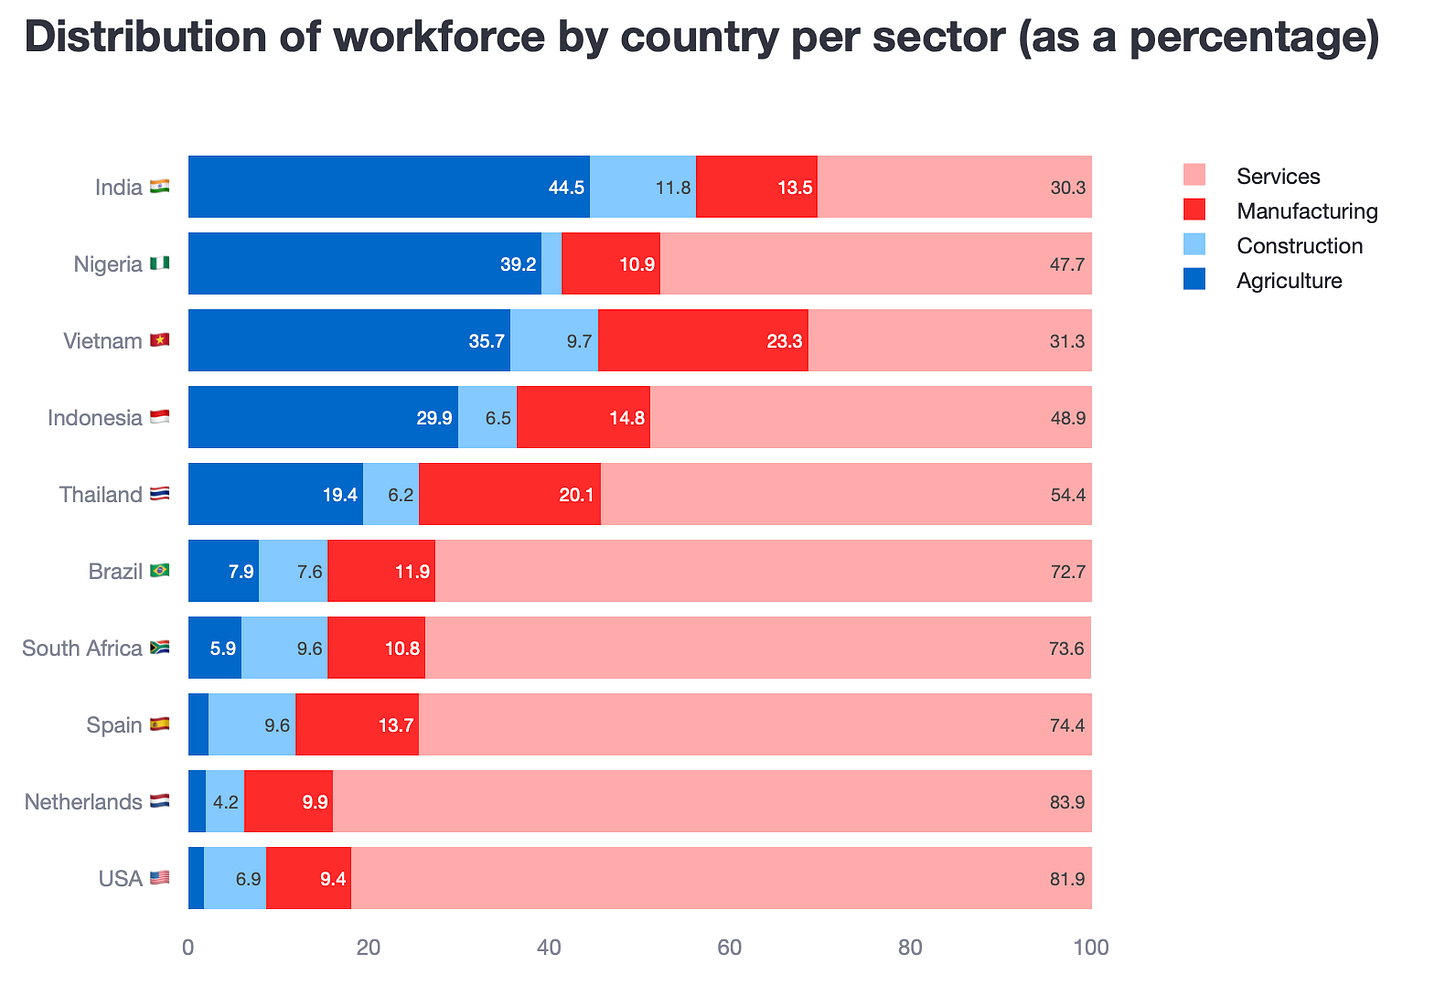
Simple methods to replace cluttered bar charts with crisp, reader-friendly visuals.
14 min read -

Plotting continuous real-time data with deque
7 min read -

Why descriptive statistics aren’t enough and plotting your data is always essential
10 min read -

Showcasing Soaring Wildfire Counts With Streamlit and Python: A Powerful Approach
Data VisualizationAnalyzing historical wildfire trends in Canada with public data
13 min read -

Our weekly selection of must-read Editors’ Picks and original features
4 min read -

Discover the #1 strategy to handle skyscraper bars in your charts
8 min read -

How to visualize country borders with Python
8 min read